‘OMG earthquake!’
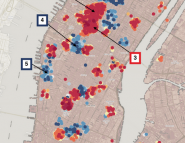
That is a report from a new type of seismograph, with two feet, two hands, (fully-functioning brain optional) and a Twitter account! Twitter users responded massively to the Mineral, VA earthquake in August 2011. The movie shown here depicts the locations of Twitter references to the earthquake. The early reports are all from the impact area, but soon the Twitter newswave overtakes the earthquake shockwave, getting the whole nation involved.
And a mapping of their locations. During the first 4-5 minutes, the responses delineate ideally the earthquake impact area, and after that break to a national cyber event.
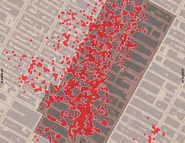
In the figure below, the gray area represents the transition from where the earthquake was felt (left of it) to where it was not (right of it). You can see that during the first 5-6 minutes we get clusters reporting it within the impact area, and few sporadic responses outside of it. For more information check out our publication #Earthquake: Twitter as a Distributed Sensor System at http://bit.ly/11seP1m.
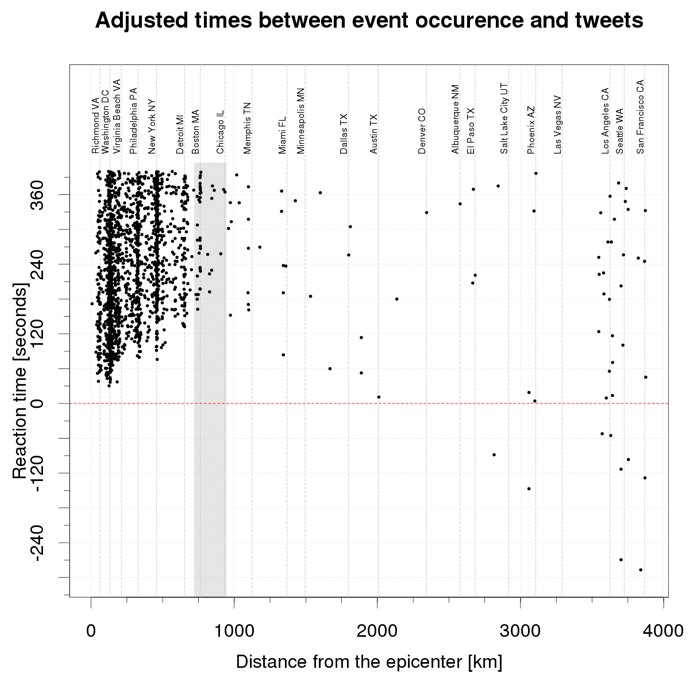
Twitter response pattern to the earthquake: Response time
as function of distance from epicenter: first 400 seconds after the event. Reaction
time is adjusted to reflect the local arrival time of the earthquake wave.