Posted: November 28, 2014 at 3:48 pm, Last Updated: January 27, 2017 at 3:19 pm
Over the last decade we have witnessed a significant growth in the use of social media. Interactions within their context lead to the establishment of groups that function at the intersection of the physical and cyber spaces, and as such represent hybrid communities. Gaining a better understanding of how information flows in these hybrid communities is a substantial scientific challenge with significant implications on our ability to better harness crowd-contributed content. This paper addresses this challenge by studying how information propagates and evolves over time at the intersection of the physical and cyber spaces. By analyzing the spatial footprint, social network structure, and content in both physical and cyber spaces we advance our understanding of the information propagation mechanisms in social media. The utility of this approach is demonstrated in two real-world case studies, the first reflecting a planned event (the Occupy Wall Street – OWS – movement’s Day of Action in November 2011), and the second reflecting an unexpected disaster (the Boston Marathon bombing in April 2013). Our findings highlight the intricate nature of the propagation and evolution of information both within and across cyber and physical spaces, as well as the role of hybrid networks in the exchange of information between these spaces.
Research highlights include:
- Our analysis includes two major events as captured in Twitter.
- The themes in cyber and physical communities tend to converge over time.
- Messages among physical space users are more consistent at the onset of the event.
- Geolocated users are consuming information more than they produce.
 |
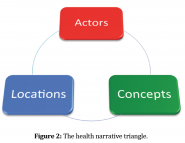
| Our Geosocial analysis framework |
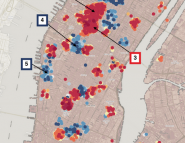
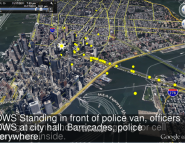
In the figure below we show an example of using DenStream for spatiotemporal clustering and how the process can capture the protest activities that were planned for the Occupy Wall Street movement’s Day of Action. Each dot corresponds to the originating location of a geolocated tweet; The color of each point indicates the time of the corresponding tweet, ranging from dark blue (early morning, 0) to dark red (late night, 1). While the circles represent a specific spatiotemporal cluster. For example the circle labeled A marked the start of the day where people congregated around Wall Street while circle labeled C shows a cluster at Foley Square.
 |
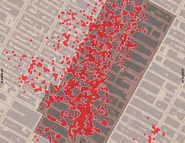
| Physical space groups identified in the lower Manhattan area. Each dot corresponds to the originating location of a geolocated tweet; The color of each point indicates the time of the corresponding tweet, ranging from dark blue (early morning, 0) to dark red (late night, 1). |
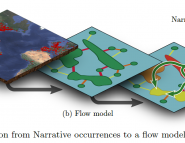
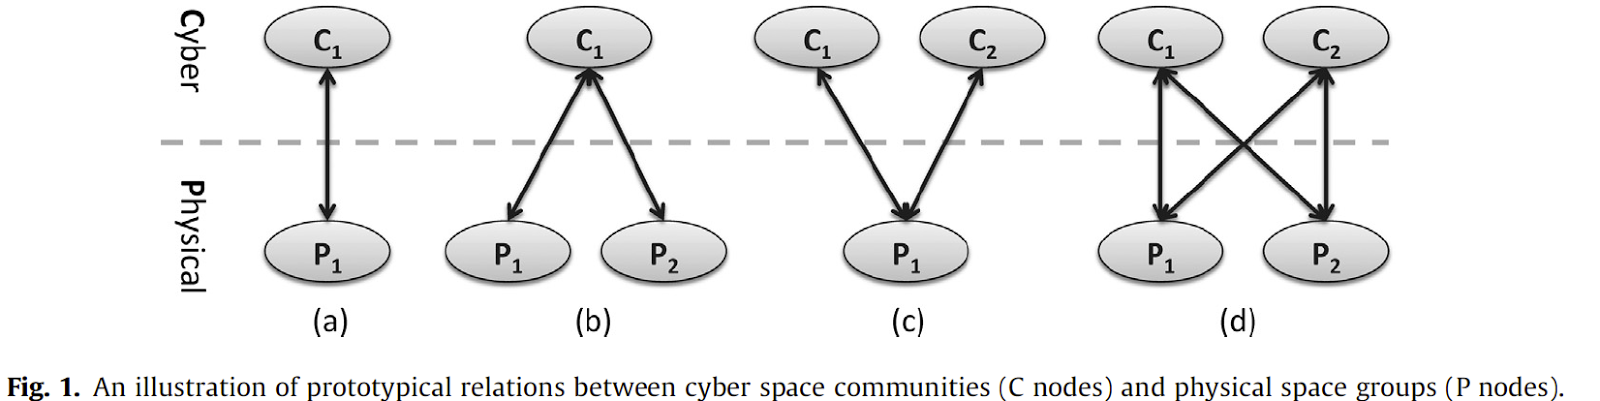
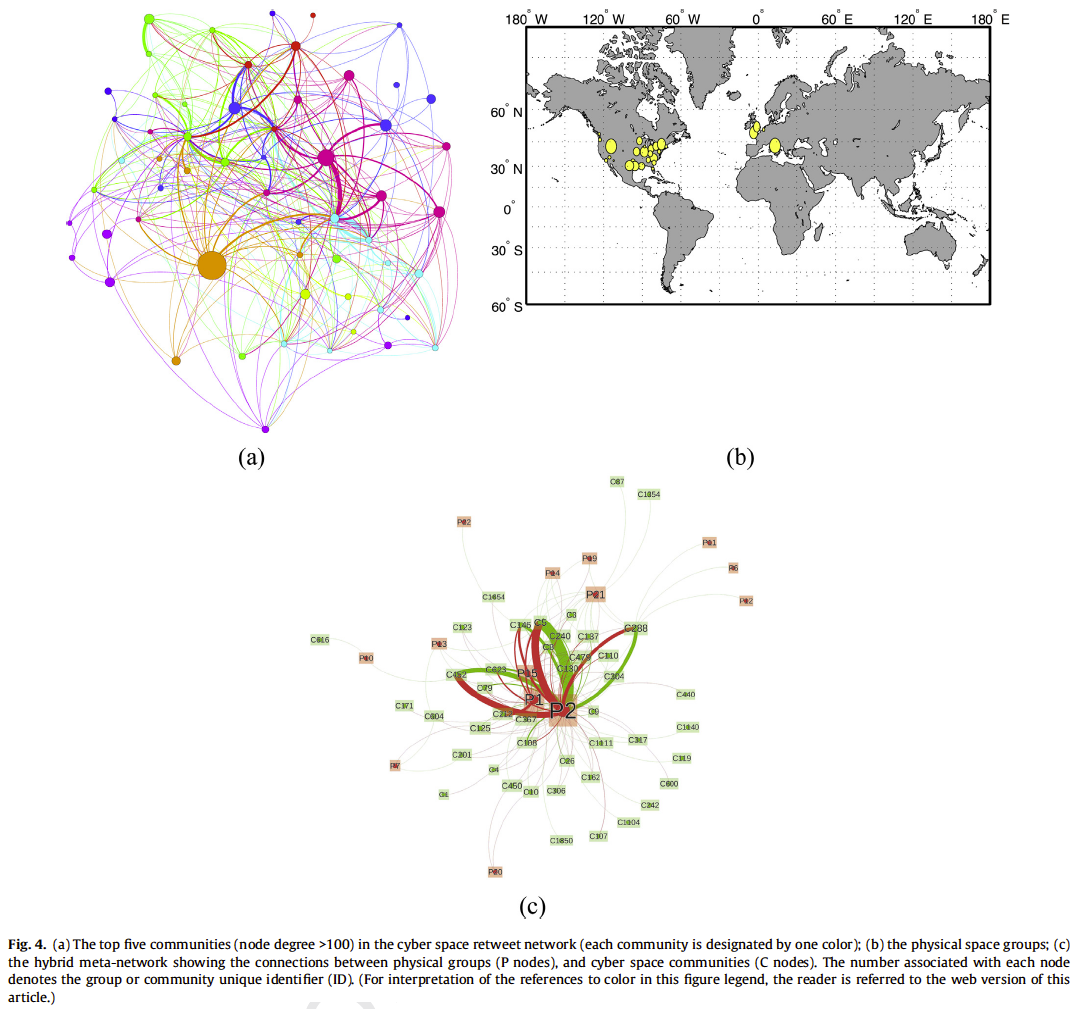
While in the figure below we show one example of linking the cyber and physical communities. Specifically in (a), the top five communities (node degree > 100) in the cyber space retweet network (each community is designated by one color) are shown; (b) shows the physical space groups; and (c) shows the resulting hybrid meta-network where the connections between physical groups (P nodes), and cyber space communities (C nodes) are shown.
We hope you enjoy the paper.
Full Reference:
Croitoru, A., Wayant, N., Crooks, A.T., Radzikowski, J. and Stefanidis, A. (2015), Linking Cyber and Physical Spaces Through Community Detection And Clustering in Social Media Feeds, Computers, Environment and Urban Systems, 53: 47–64. (pdf)