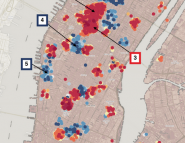
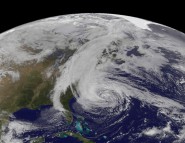
Extending our work towards harvesting social media to determine a population’s mood, our group has started looking into the use of language in Twitter as Hurricane Sandy bore down on the East Coast of America during late 2012. What we show here is a basic visualization GeoSocial Analysis of tweets by time, location, and sentiment (here calculated by a coarse positivity/negativity measure).
We harvested relevant tweets using keywords such as “Sandy”, “Hurricane”, and “Frankenstorm” during a one-week period starting just before the hurricane hit the East Coast. What you see in the videos are a sample of a hundreds of thousands of tweets and the sentiment they convey.
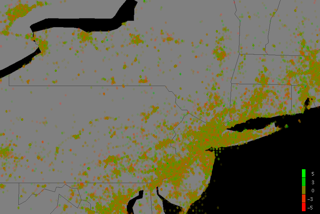
For each tweet, the text is stripped of punctuation, and broken into individual words. The sentiment of each tweet is then an expression of the total sentiment values of each word within it. In the following images and movies positive tweets are green and negative tweets are red.
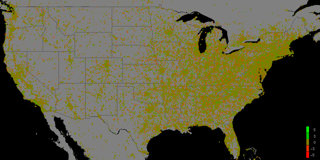
YouTube Movie: United States
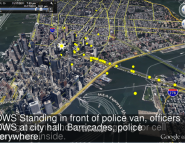
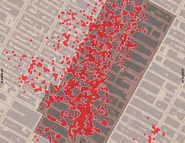
YouTube movie: New York