Posted: June 5, 2015 at 9:32 am, Last Updated: January 27, 2017 at 3:24 pm
We recently had a paper accepted in the International Journal of Digital Earth entitled “Mapping floods due to Hurricane Sandy using NPP VIIRS and ATMS data and geotagged Flickr imagery“.
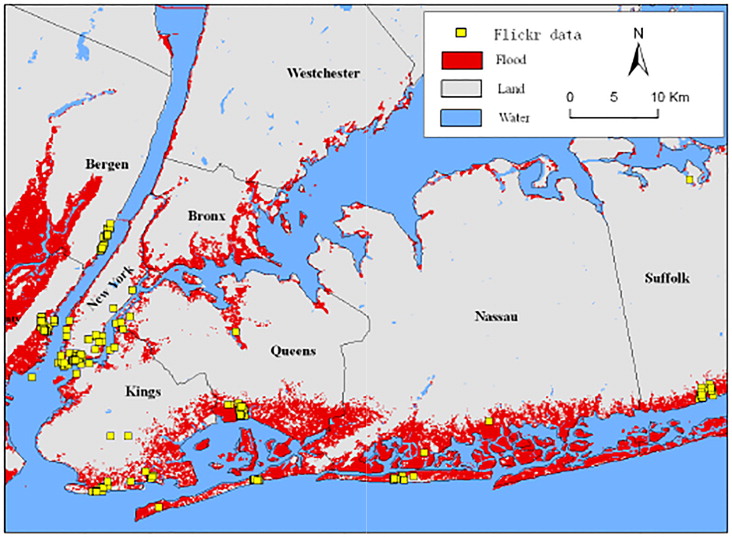
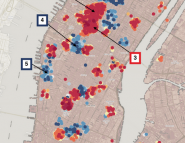
Flickr images reporting flooding (yellow dots) overlaid on the ATMS-derived flood map
in the vicinity of New York City and its boroughs.
Below you can see the abstract of the paper:
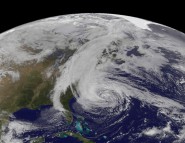
In this study, we present an approach to estimate the extent of large-scale coastal floods caused by Hurricane Sandy using passive optical and microwave remote sensing data. The approach estimates the water fraction from coarse-resolution VIIRS and ATMS data through mixed-pixel linear decomposition. Based on the water fraction difference, using the physical characteristics of water inundation in a basin, the flood map derived from the coarse-resolution VIIRS and ATMS measurements was extrapolated to a higher spatial resolution of 30 m using topographic information. It is found that flood map derived from VIIRS shows less inundated area than the Federal Emergency Management Agency (FEMA) flood map and the ground observations. The bias was mainly caused by the time difference in observations. This is because VIIRS can only detect flood under clear conditions, while we can only find some clear-sky data around the New York area on 4 November 2012, when most flooding water already receded. Meanwhile, microwave measurements can penetrate through clouds and sense surface water bodies under clear-or-cloudy conditions. We therefore developed a new method to derive flood maps from passive microwave ATMS observations. To evaluate the flood mapping method, the corresponding ground observations and the FEMA storm surge flooding (SSF) products are used. The results show there was good agreement between our ATMS and the FEMA SSF flood areas, with a correlation of 0.95. Furthermore, we compared our results to geotagged Flickr contributions reporting flooding, and found that 95% of these Flickr reports were distributed within the ATMS-derived flood area, supporting the argument that such crowd-generated content can be valuable for remote sensing operations. Overall, the methodology presented in this paper was able to produce high-quality and high-resolution flood maps over largescale coastal areas.
Keywords: coastal flood; hurricane; water fraction; high-resolution flood mapping; VIIRS; ATMS
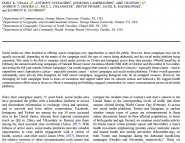
Full Reference:
Sun, D., Li, S., Zheng, W., Croitoru, A., Stefanidis, A. and Goldberg, M. (2015): Mapping floods due to Hurricane Sandy using NPP VIIRS and ATMS data and geotagged Flickr imagery, International Journal of Digital Earth, DOI: 10.1080/17538947.2015.1040474 (PDF).
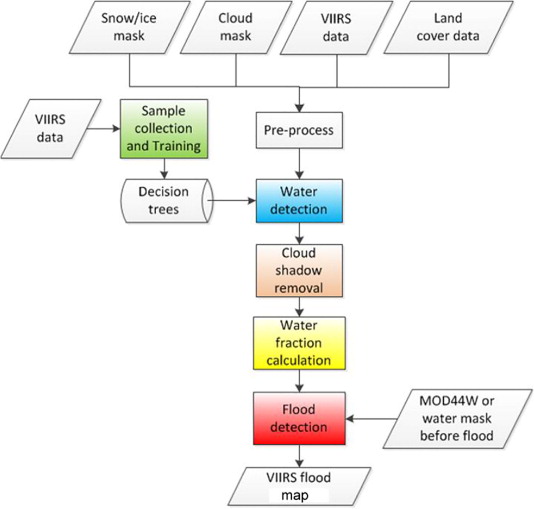
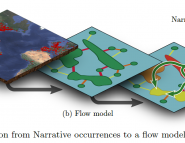
Flowchart for deriving flood from VIIRS data